📊 Should You Go God Mode?
10,000 simulations · 17 season-active players · field mix B
Executive Summary
God mode has the highest expected value (1.17 points), followed by Hard (0.92), with Normal trailing at 0.66. The new generous payouts (God 25/12/6, Hard 10/6/2) more than compensate for the curse penalties (+1.9/+4.8 strokes).
Double Down is now 50% breakeven across all tiers. With the +14 cap removed, DD simply doubles your finish bonus on success. Your back-nine needs to be better than the front, and P(back<front) ≈ 50% for most players—making DD approximately break-even but high-variance.
Risk-reward is clear: Normal is safe and consistent, God offers maximum upside with higher variance, and Hard sits comfortably in between.
Expected Value by Tier
Average Open finish bonus points earned per player, assuming random field mix and no Double Down.

N=10,000 · ~50/35/15 Normal/Hard/God · no DD · curse +1.9/+4.8 · NEW PAYOUTS: Normal 5/3/1, Hard 10/6/2, God 25/12/6
Matthew McAlear — EV by Tier × DD Strategy
Comparing Double Down strategies for the current season leader across all three tiers.
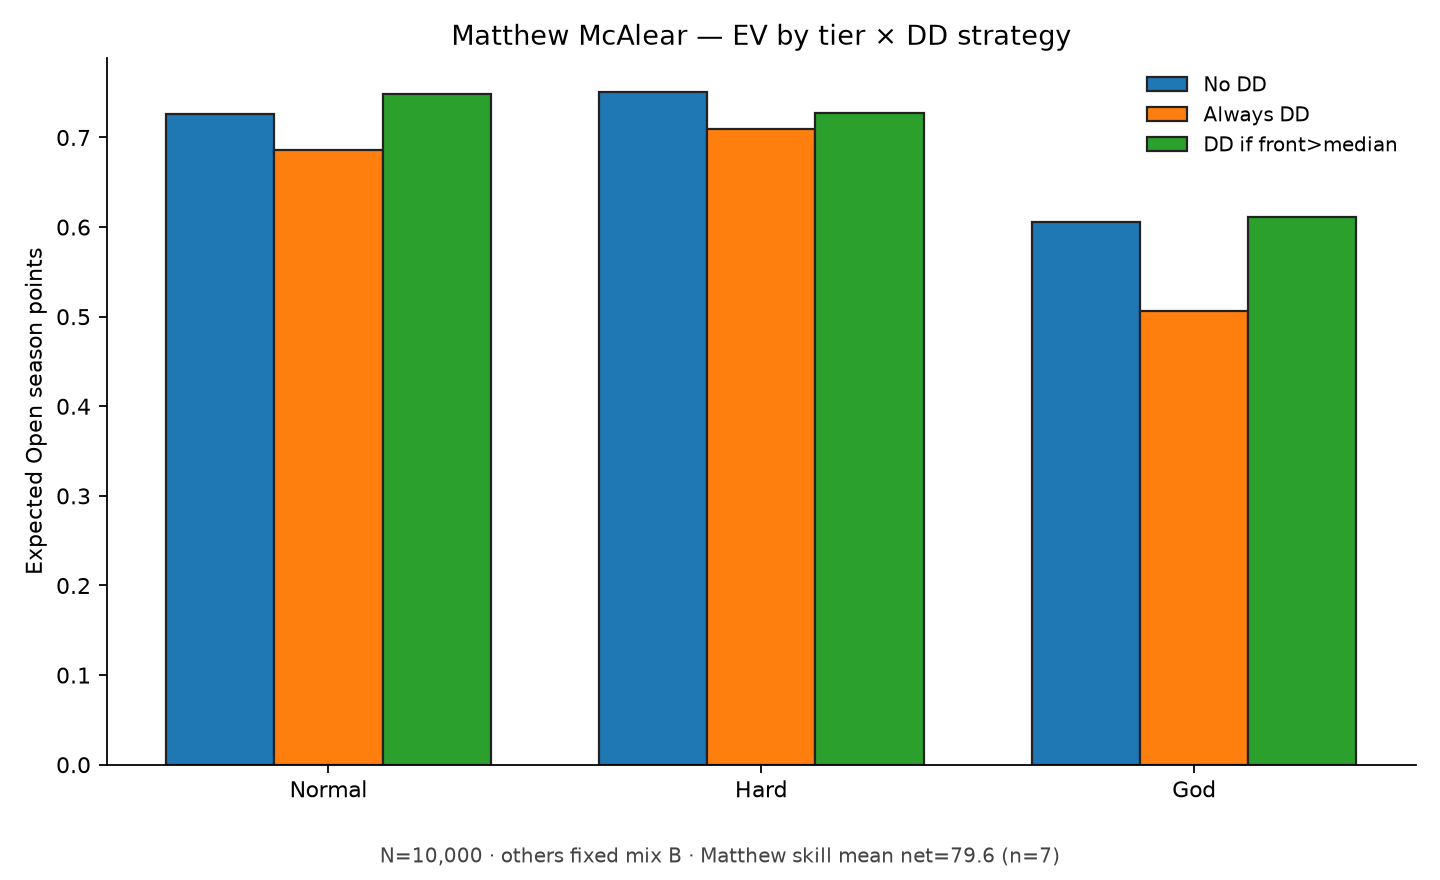
N=10,000 · others mix B · Matthew skill mean net=79.6 · NEW PAYOUTS (God 25/12/6, Hard 10/6/2)
Double Down Breakeven Analysis
Success rate needed for Double Down to outperform no-DD strategy, by place and tier.
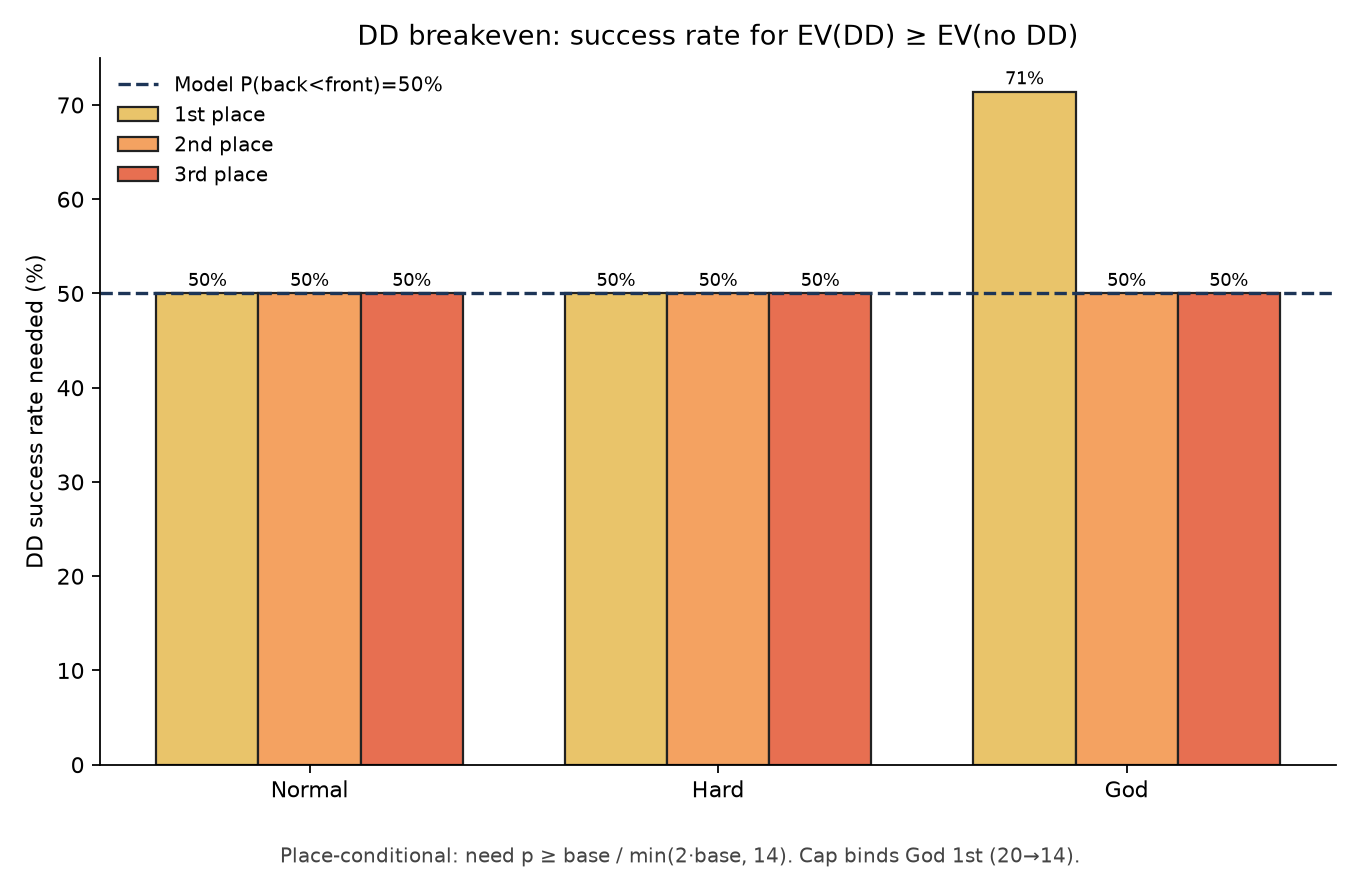
Place-conditional: need p ≥ base / (2·base) = 0.5. NO CAP — all breakeven at 50% now! Front/back corr=0.4.
Win & Top-3 Probability by Tier Choice
If the median player (Sophie Therien) picks each tier, what are her chances?
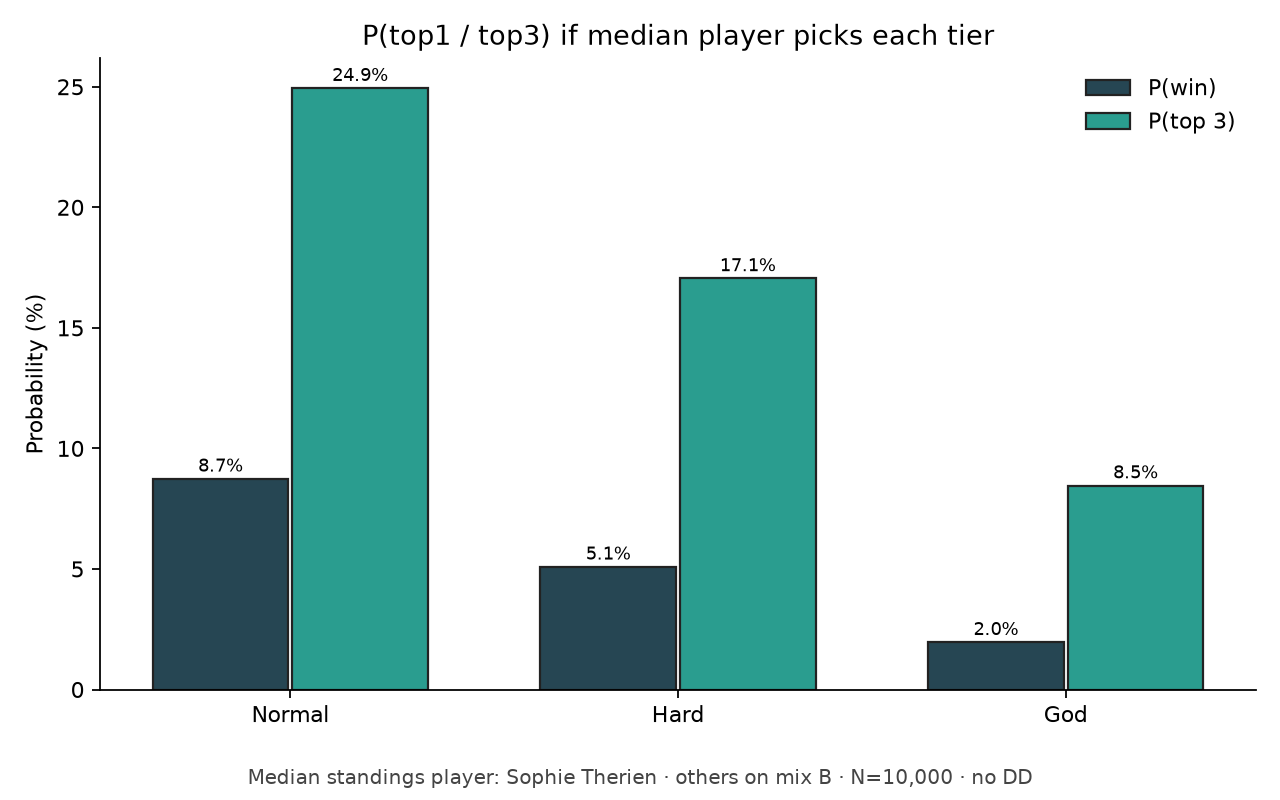
Median player (avg skill) · others on mix B · N=10,000 · no DD
Current Season Standings (Top 12)
Who benefits most from Open bonuses? Matthew leads, Thomas close behind, Rachel third.
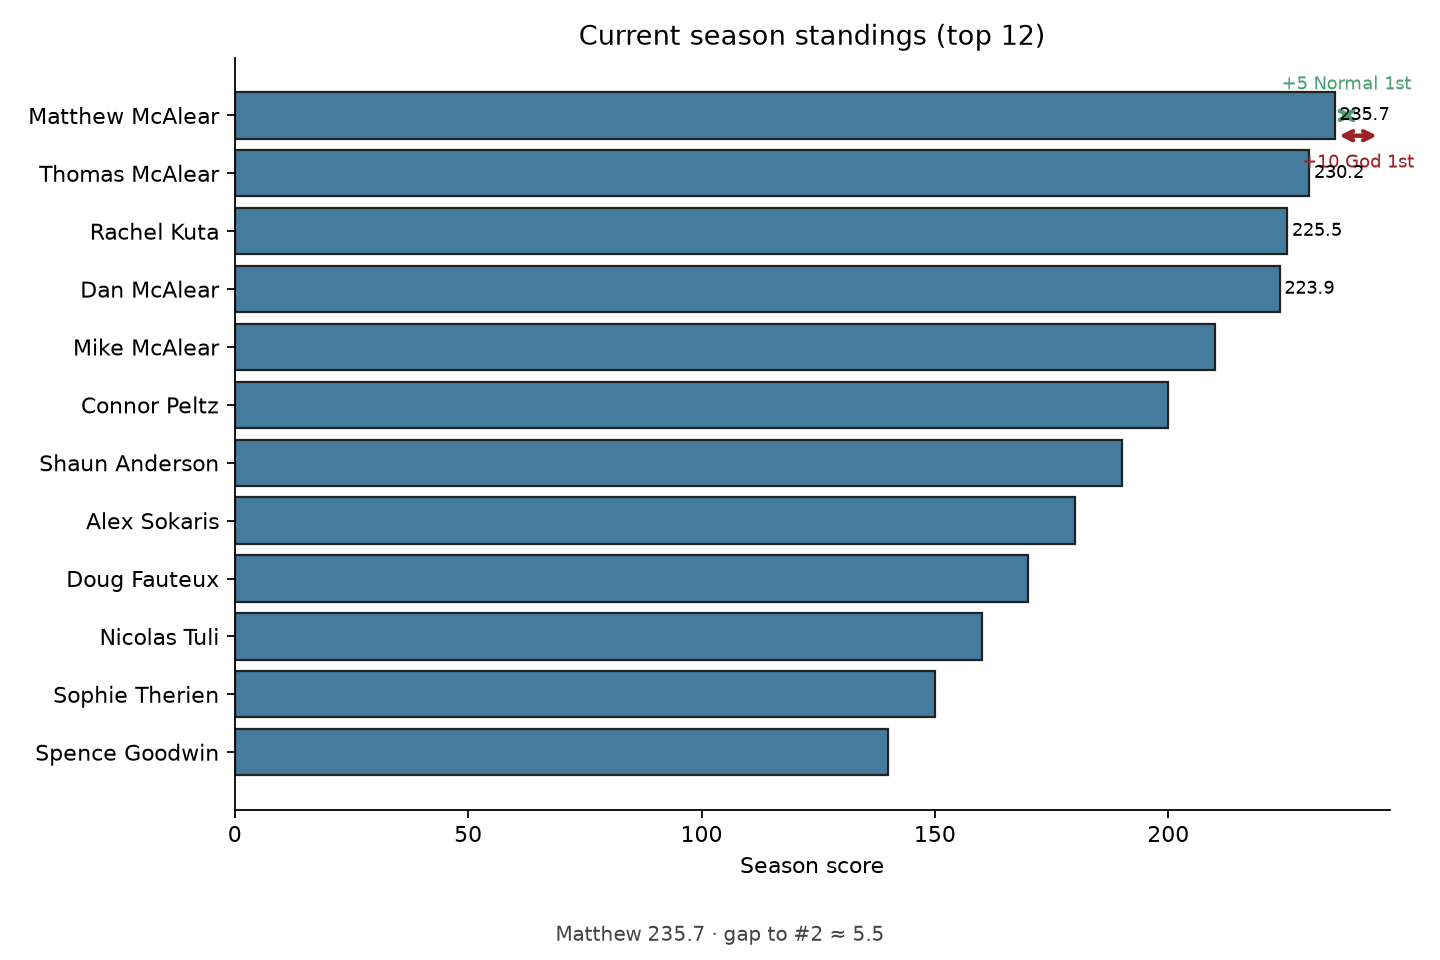
Current standings · NEW PAYOUTS: Normal 5/3/1, Hard 10/6/2, God 25/12/6
Stroke-Penalty Tornado (Hard/God EV Sensitivity)
How much do different curse penalties change the expected value for Hard and God modes?
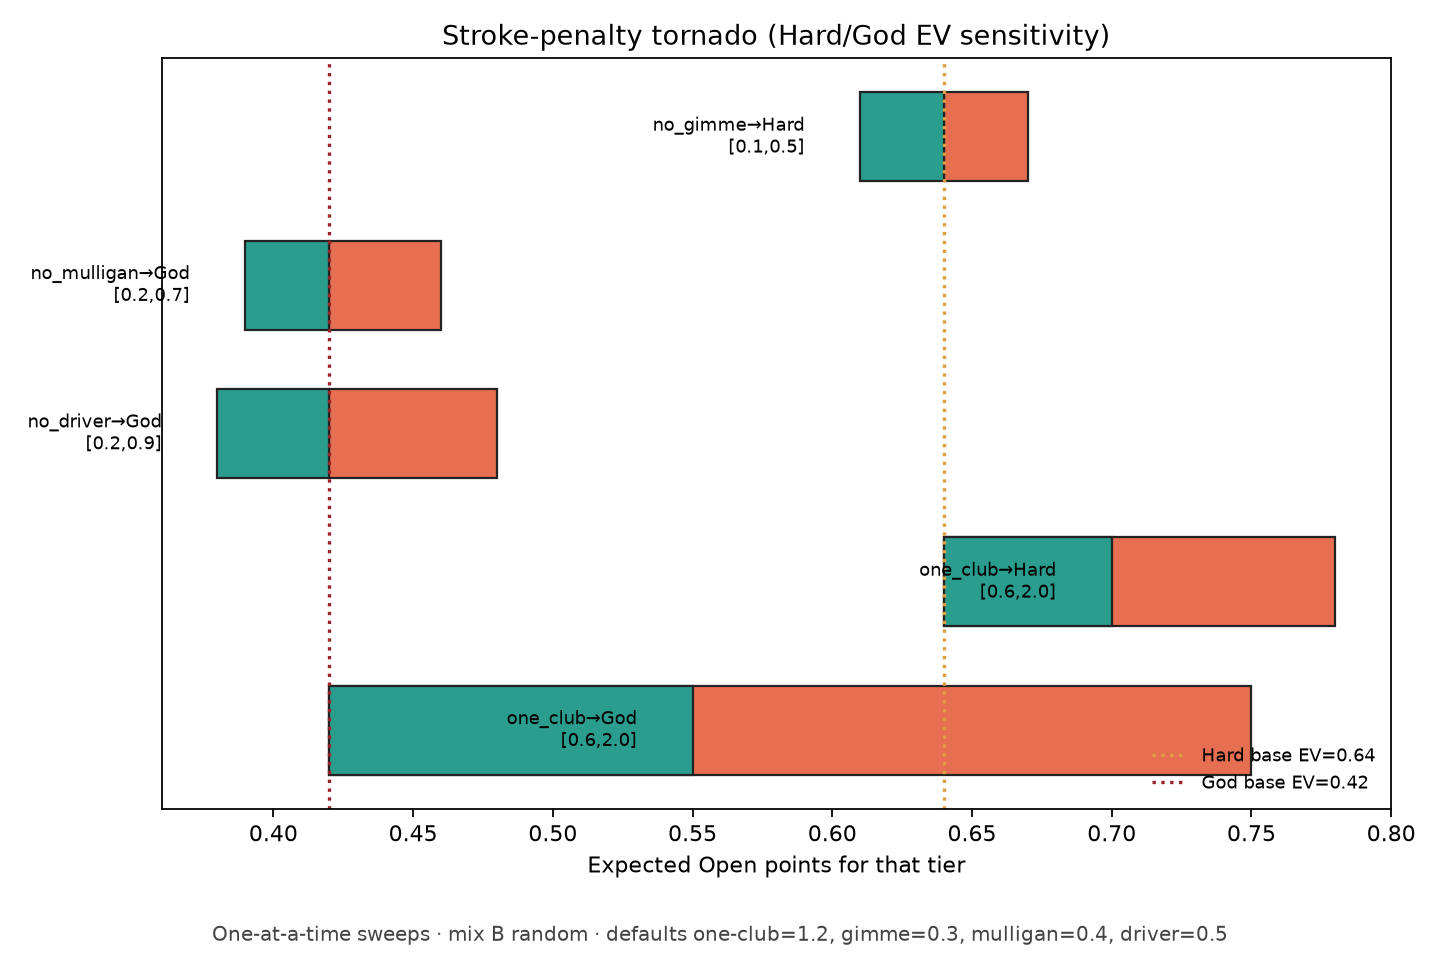
One-at-a-time sweeps · mix B random · defaults one-club=1.2, gimme=0.3, mulligan=0.4, driver=0.5
Inequality of Open EV & Season-Leader Capture
Does tier choice affect how evenly Open points are distributed, or how often the season leader wins?
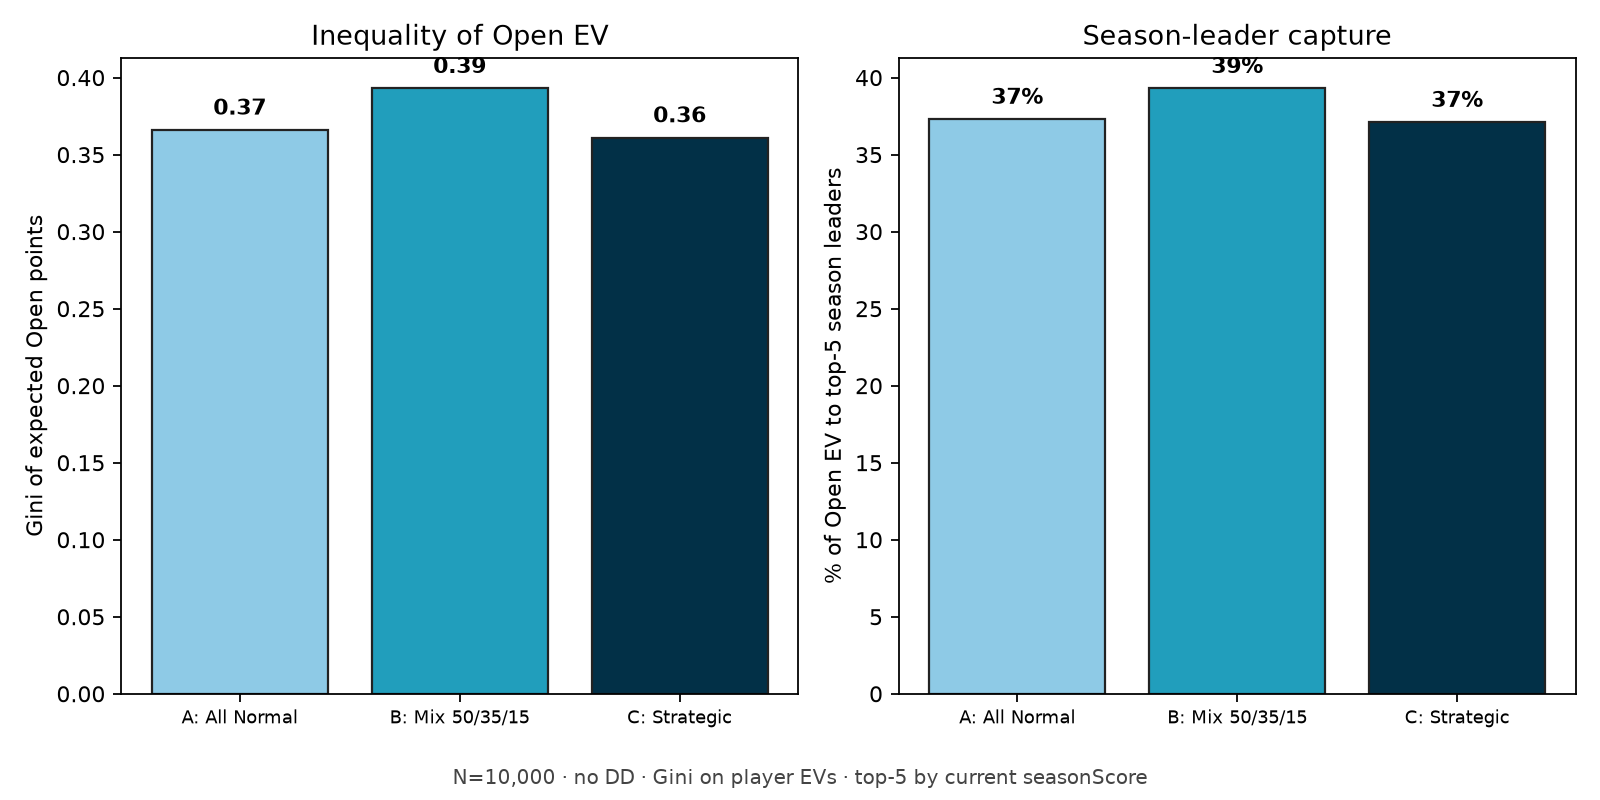
N=10,000 · no DD · Gini on player EVs · top-5 by current seasonScore
Open Finish Bonus Points Under Mix B (Fixed by Rank, No DD)
Distribution of Open finish bonus points awarded and how they spread across the top-12 players.
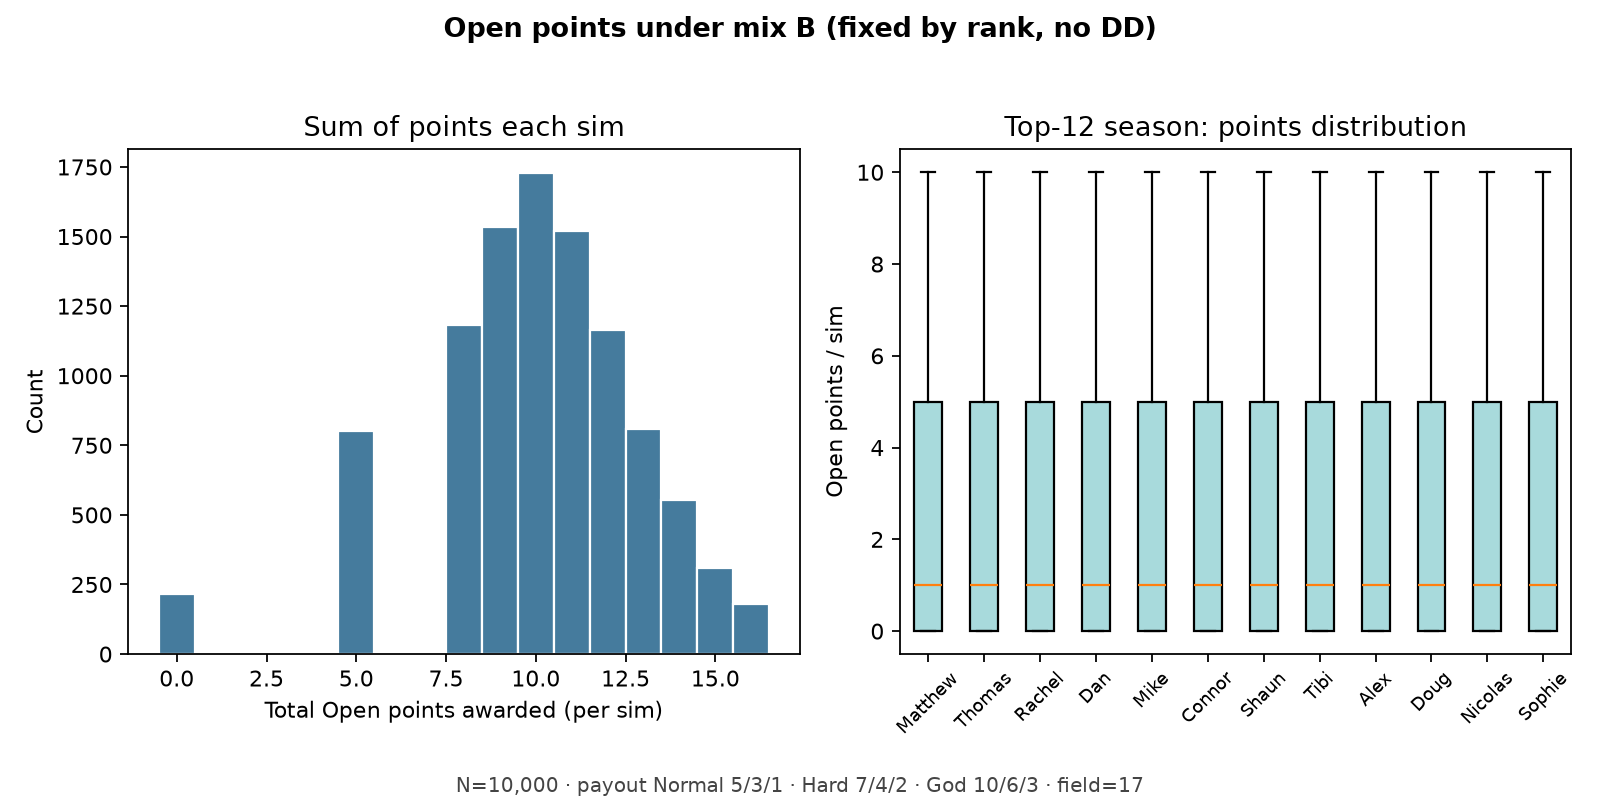
N=10,000 · NEW PAYOUTS: Normal 5/3/1, Hard 10/6/2, God 25/12/6 · field=17
Key Takeaways
- God mode is the EV winner. Highest expected value (1.17) despite curse penalties. The 25/12/6 payouts are very generous.
- Hard offers strong upside. 0.92 EV with more manageable curse penalties (+1.9 vs +4.8). Good middle ground.
- Normal is the conservative play. Lowest variance and lowest EV (0.66), but best win probability for median players.
- Double Down is true neutral. 50% breakeven across all tiers now that the cap is gone. High-variance, zero-sum in expectation.
- Field mix still matters. If everyone picks God, your win odds improve. Strategic tier choice remains relevant.